The All-NBA Team is an honour bestowed on the best players in the league after every season. The team is composed of three 5-man lineups – a first, second, and third team. Voting is conducted by a panel of sports writers and broadcasters around the league.
Every year, towards the end of another NBA season, the argument surrounding who’s going to make the All-NBA Team is always up for discussion. There are seasons where a player’s performance should guarantee him a spot on the roster by unanimous decision (the Greek Freak in the 2018-19 campaign), but there are also cases where the decision is not so straightforward and a player might end up getting snubbed (ahem Bradley Beal).
To assist me in the debate, I created a model to help me predict who will make the All-NBA Team based on their performance after a given season.
Data Collection
Data was collected from the fan-beloved third-party Basketball Reference website. Basketball Reference has a comprehensive database of historical player data and the site allows me to directly download CSV files. I only considered All-NBA selections from the 1999-00 season and onwards. The raw data I collected consists of player season total stats from the 1999-00 season up until the 2018-19 season. The data is well formatted so only minor data processing is required. I also combined the dataset with information on a player’s draft year to calculate how long he has been in the NBA, and whether or not a player made the All-NBA Team for that given season.
 Basketball Reference: Player Totals for 2018-19 season - snippet of what the raw data looks like
Data Processing
The dataset is nice and consistently formated for all seasons, but there are a couple minor subtleties that I needed to sort out.
First, I removed any asterisks from player names if found. Asterisks exist in the dataset because there might be a footnote on the Basketball Reference website, but I don’t need that information. This is rather straightforward since I can replace any instances of a '*' with an empty string ''.
Second, the formatting of a player’s name needed to be fixed. The raw data comes in the format of 'Chris Paul\paulch01' when really we just want 'Chris Paul'. Bball-ref does this to handle the odd chance that two players have the same exact name. I solved this issue with some simple text cleaning in R:
# treat names at strings
df$Player <- as.character(df$Player)
  # split name variable by [\\]
  names <- strsplit(as.character(df$Player), "[\\]")
  # reassign the clean name
  for (i in 1:dim(df)[1]) {
    name <- names[[i]][1]
    df$Player[i] <- name
  }
Last, I noticed that there are rows of data for players’ total (TOT) stats that aggregated their single season stats for all the teams they played for that year (i.e. when a player gets traded in the middle of the season). Here’s a screenshot of what that looks like in the data:
 Data point where Tm = TOT to aggregate Chauncey’s 2009 season stats from the two teams he played for that year
I decided to remove these TOT rows and consider each individual team a player played for in a given season as independent data points. This did not seem to be a problem because there were only two instances of this occurring in the last 20 seasons where a player was traded mid-season and still wound up making the All-NBA Team (Chauncey Billups traded from Detroit to Denver in the 2008-09 season and Dikembe Mutombo traded from Atlanta to Philadelphia in the 2000-01).
From here, I looped through each year in our dataset, loaded in the CSV for that year, cleaned and processed the data, and finally merged the results into one larger dataset. The final dataset consists of the players’ total stats (in the format shown above), the players’ draft year, and whether or not that player made the All-NBA Team, for every season.
Data Analysis
Before modeling, I did some summary analysis on the large dataset. First, a simple summary() in R with out total player stats for all seasons:
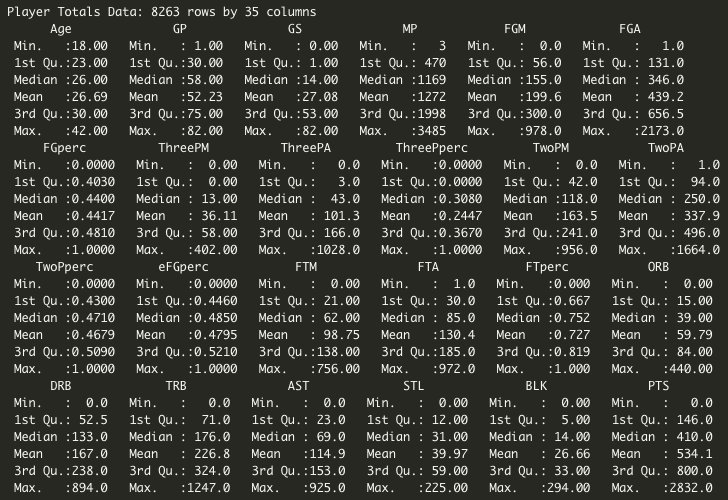 Data Summary: Player Totals from 1999 - 2019
As expected, the data shows that there are a large range of values for any given statistic, so I decided to normalize each statistic for each season. Simply, for each season we have in the dataset, I divided each stat for every player by the given season’s max. This means that each stat now lies in the range (0,1) and the stat leader will have the max value of 1.
To get a sense of which columns might serve as useful predictors I created a correlation plot to see which stats correlated most with making the All-NBA Team. After that, I modeled the distribution of each statistic, comparing stats of players who made the All-NBA-Team vs players who did not. Let’s take a look at these results:
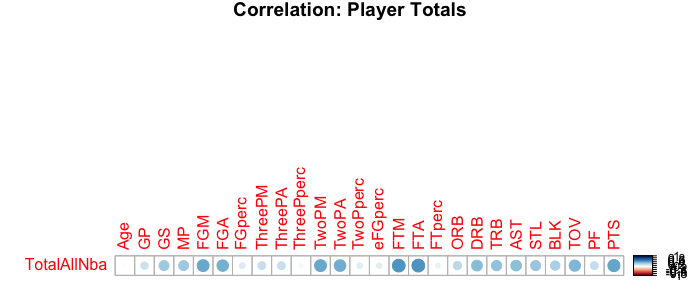 Correlation Plot: Player Totals vs All-NBA
The correlation plot shows slightly positive correlation for making the All-NBA Team with Games Started, Field Goals Made, Field Goals Attempted, Free Throws Made, Free Throws Attempted, Rebounds, Assists, Steals, Blocks, and Turnovers, and even stronger correlation for the scoring stats.
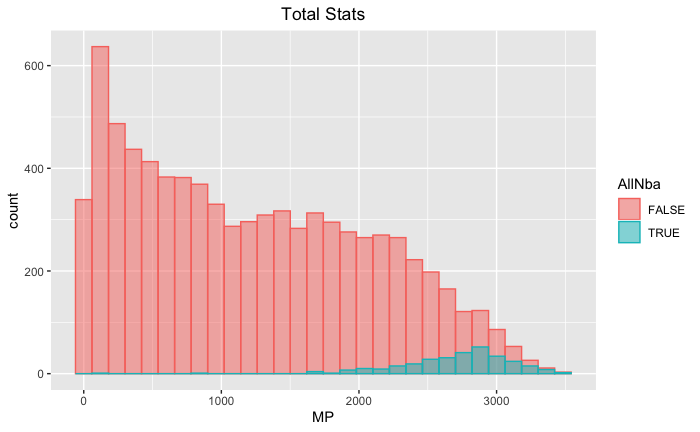 Distribution Plot: Minutes Played vs All-NBA
Also, note that we have nearly 8300 observations with 35 columns each. By modeling the distribution of each statistic comparing All-NBA players against the rest of the league, I might be able to find ways to filter out data points that could potentially dilute the model’s ability to showcase elite players. I do not want to flood the model with bench / rotational players who aren’t in consideration for All-NBA honours. I used Minutes Played during a season as a proxy and only considered players who play at least 1600 minutes in a season.
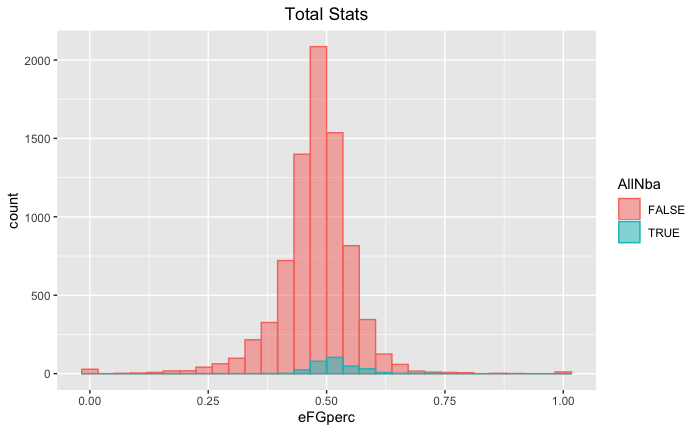 Distribution Plot: eFG% vs All-NBA
From the data, I found that All-NBA players are performing above average in the counting stats compared to the rest of the league, which is a fairly trivial solution. However, a more interesting discovery is that the distribution of the different shooting percentages (FG%, 3P%, 2P%, eFG%, and FT%) don’t vary much. Above, we see that the distribution of effective Field Goal Percentage for All-NBA players follows a very similar shape compared to the rest of the league. In fact, All-NBA players have similar distributions in all shooting percentages compared to the rest of the league, and are not actually shooting consistently better or more efficiently.
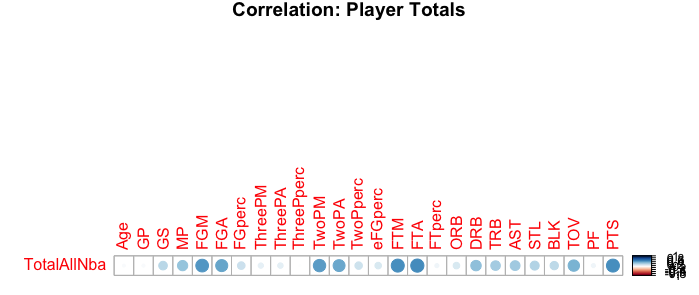 Filtered Data Correlation Plot: Player Totals vs All-NBA
After removing observations from the dataset for players who did not play more than 1600 minutes in a given season, the new correlation plot shows slightly stronger correlation for various stats. What I found interesting from this plot is that Turnovers have a slightly strong correlation, but I infer that turnovers might be a indicator for usage rates, and that All-NBA players have high usage rates, and with high usage rates comes more turnovers.
Modeling
I implemented both linear and logistic regression models to predict All-NBA players. I used the step() function to identify model with the most relevant variables in the player season totals dataset. Also, since the All-NBA Team honours players based on their position: guard, forward, and center, I decided to fit separate models for each position. The code looks something like this:
# treat names at strings
lm.guard.total.reduced <- lm(TotalAllNba ~ GP + GS + MP + FGM + ThreePM +
                                           ThreePA + ThreePperc + TwoPM +
                                           TwoPA + TwoPperc + eFGperc +
                                           FTM + FTperc + DRB + AST + STL
                                           + BLK + TOV + PF,
                             data = guard_data_totals[which(guard_data_totals$Season != 2019), ])

log.forward.total.reduced <- glm(TotalAllNba ~ MP + Age + FGperc +
                                               ThreePperc + TwoPM +eFGperc
                                               + FTM + DRB + TRB + AST +
                                               STL + BLK + TOV + PTS,
                                data = forward_data_totals[which(forward_data_totals$Season != 2019), ], family = binomial(link = "logit"))
Accuracy
I used the data from the 1999-00 season up until the 2017-18 season to predict All-NBA players for the end of the 2018-19 season. Now, to measure model performance, I first make predictions using these models, and then compared them to the actual results to see how accurate these predictions turned out to be. To do this, I created two functions to do both tasks:
# Predict All-NBA Response
# will predict response for data using the model given, and will return an ordered list
# ranking the nba players from highest probability of being selected as an All-NBA
# player to lowest
predAllNbaPlayers <- function(data, model) {
  pred <- predict(model, newdata = data, type = "response")
  all_nba_players <- data[0, ]
  all_nba_players <- data[order(pred, decreasing = TRUE), ]
  return(all_nba_players)
}

# Calculate Accuracy
# will calculate the accuracy of the prediction
calcAccuracy <- function(all_nba_players) {
  correct <- all_nba_players[which(all_nba_players$TotalAllNba == 1),]
  return(dim(correct)[1] / dim(all_nba_players)[1])
}
The first function makes predictions for each player, then sorts the players from highest predicted odds in each season to lowest. I then grab the top 6 guards, the top 6 forwards, and the top 3 centers from the sorted prediction lists to form the 15 player All-NBA Team. The second function compares the chosen All-NBA players to the actual All-NBA players from the 2018-19 season and returns the accuracy. Let’s compare the results for the linear and regression models (full model with all variables and the reduced model):
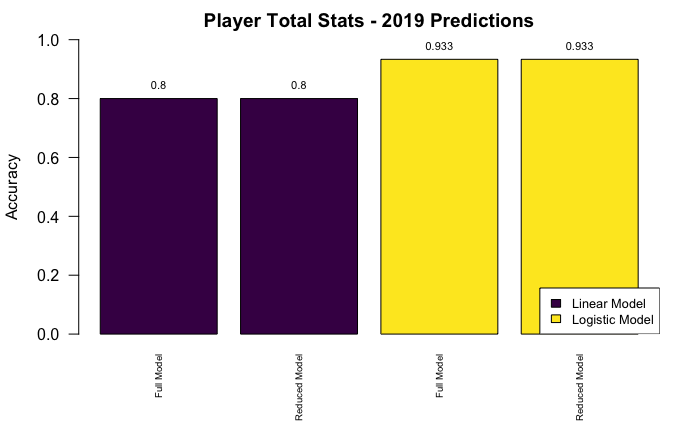 2018-19 All-NBA Prediction: Model Accuracy
The results show that the linear model correctly predicted 12/15 All-NBA players and the logistic model correctly predicted 14/15 All-NBA players. Also, it’s worth noting that the reduced models performed the same as the full models, thus, I will use the reduced models going forward.
Cross Validation
With the simpler models, I cross-validated to see which model performs the best out of the two (linear vs logistic). Using the 1999-2019 data, I will test the model accuracy by using all the years, except for 1, to train the model and predict All-NBA players for the 1 season left out of the training data set, and do so for each and every year.
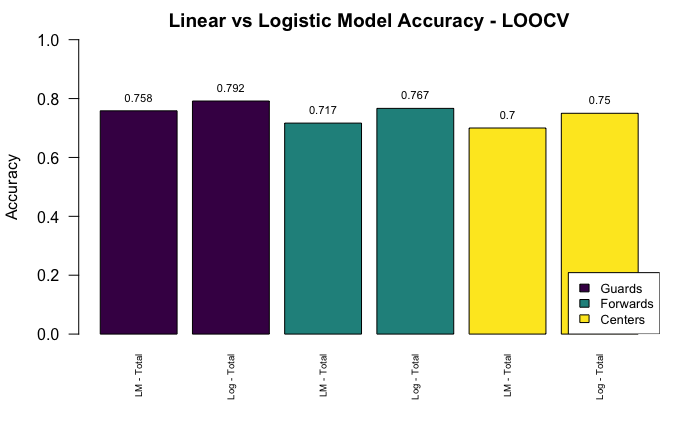 Leave One Out Cross Validation: All-NBA Prediction Model Accuracy
I predicted the All-NBA guards, forwards, and centers separately for each year, and then took the average of the model’s accuracy respectively. The logistic models out performed the linear models for each position: the guard model accurately predicting the All-NBA guards 79.2% of the time, the forward model accurately predicting the All-NBA forwards 76.7% of the time, and the center model accurately predicting the All-NBA centers 75% of the time, for each season between 2000-2019.
Prediction
For the 2018-19 NBA season, the model predicted that the All-NBA Team will consist of:
| Guards | Forwards | Centers |
|---|---|---|
| James Harden | Giannis Antetokounmpo | Rudy Gobert |
| Russell Westbrook | Kevin Durant | Joel Embid |
| Damian Lillard | Paul George | Anthony Davis |
| Kemba Walker | LeBron James | |
| Stephen Curry | Kawhi Leonard | |
| Kyrie Irving | Blake Griffin |
The model correctly predicted every All-NBA player for the 2018-19 season, except for one: the model incorrectly picked Anthony Davis as an All-NBA center, which was actually awarded to Nicola Jokić.
Future Work
While the current model is performing well, there are still many other options I’d like to consider as next steps.
First, the most obvious change would be to use more complex models than a simple logistic regression model, such as random forest.
Second, I’d like to implement the use of other player data. Basketball Reference has information on players per game stats and advance stats that might have more power in prediction than players’ total season stats.
Lastly, the ultimate goal for this project is to be able to predict the number of All-NBA selections for any given player at any point in their NBA career. I would like to estimate the total number of All-NBA selections remaining in different player’s careers.
Thanks for reading. If you’re interested, my entire codebase is available here.